

Lake Levels & Conditions
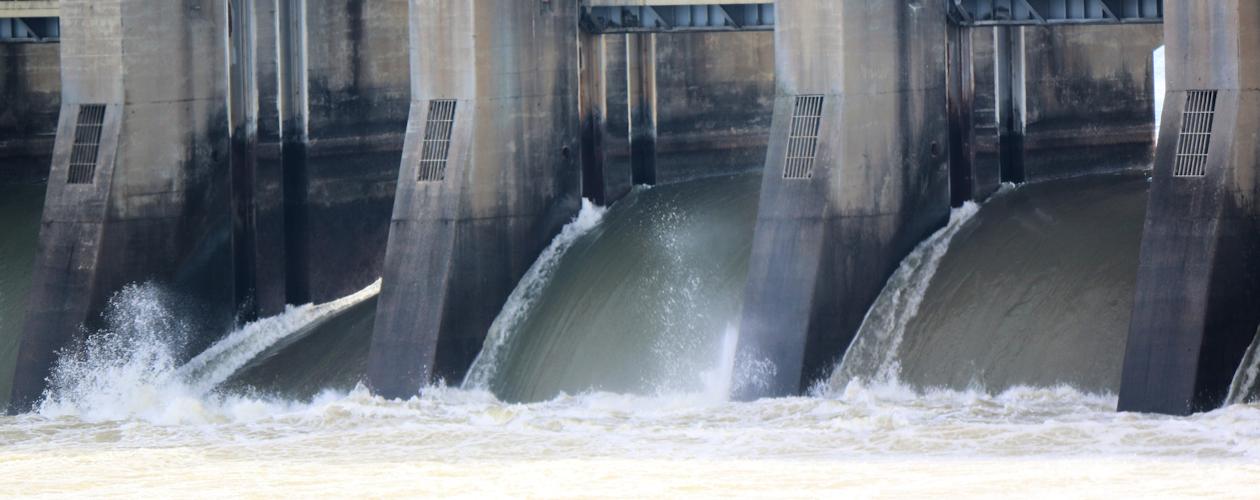
Kentucky Dam spilling 300,000 cubic feet of water per second in early 2019.


![]() > Lake Levels
> Lake Levels
Kentucky Lake Levels
Current Weather at Kentucky Lake From Kyle-Oakley Field (KCEY) / Murray, Ky. - Last Update on Apr 22 2025, 8:15 am CDT |
||||
Weather | Air Temp | Wind | Dewpoint | Pressure |
|---|---|---|---|---|
Fair |
59° |
East 7 mph |
57° |
30.14" |
From TVA as of 8 AM CDT Apr. 22
| Upper Stage | Lower Stage | Water Temp | |
|---|---|---|---|
Kentucky Lake |
359.1' |
326.5' |
64° |
Normal: |
357.8' |
302.0' |
64° |
From Normal: |
+1.3 |
+24.5 |
|
Last Hour Discharge: |
54,803 cfs |
||
Water Clarity: | Stained |
||
Generation Schedule: |
04/22/2025, Midnight - Midnight CDT - 4 or more generators |
||
Kentucky Lake Operating Guide Chart
Mobile Users: Turn your device sideways for a better chart viewing experience.
Hourly Levels & Current
Kentucky Lake Records
- Kentucky Lake Record High: 372.49'- 5/04/2011
- Kentucky Lake Record Low: 348.02' - 3/11/1961
- Kentucky Lake Record cfs: 446,000 - 1944
- Kentucky Lake Record High Water Temp: 90.8° - 8/2/11
- Kentucky Lake Record Low Water Temp: 36.2° - 1/12/2010
Explanation of Lake Level Data
Water temperatures are reported from Hancock Biological Station in Ledbetter Bay. The water temperature sensor is near the main river channel and is about three feet below the water's surface. Click here for a chart of normal water temps.
From Normal - this shows the departure from normal.
Last Hour Discharge / cfs = the amount of water discharged through the dams measured in cubic feet per second.
Water Clarity - "stained" means some murkiness or discolor in the lakes. "Normal" means typical clarity, usually 3-4 feet for Kentucky and a couple of feet for Barkley. "Muddy" means no clarity at all.
Lake elevation is based on sea-level and are provided in real-time from TVA.